This new preprint at bioRxiv is quite the Christmas present for those of us with a passion for European genetics and prehistory. It's the first paper to report on full genomes from Mesolithic and Neolithic Europe.
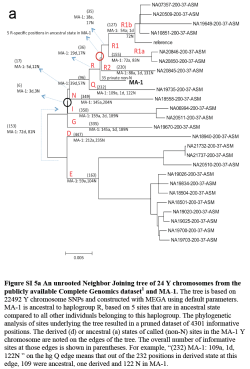
All of the successfully tested Mesolithic Y-chromosomes, one from Luxembourg and four from Motala, Sweden, belonged to haplogroup I. This probably won't come as a surprise to many people, as this marker was always the main candidate for Europe's indigenous Y-haplogroup. However, three of the results fell into haplogroup I2a1b, and none into I1, which is today the most common Y-haplogroup in most of Scandinavia.
What this suggests is that I1 expanded after the Mesolithic and replaced most of the I2a1b across Northwestern Europe. I'd say these were mostly expansions from North-Central Europe, although recent chatter on the web suggests that two distinct I1 lineages might have arrived in North-Central Europe from Eastern Europe at different times.
All of the Mesolithic mtDNA sequences belonged to haplgroups U2 and U5, which is line with past results. The single Neolithic sample, from a 7500 year-old Linearbandkeramik (LBK) site in Stuttgart, Germany, belonged to mtDNA haplogroup T2. Again, not very surprising considering what we've seen to date.
The genome-wide results, on the other hand, are not as straightforward. The basic upshot is that Northern Europeans are mostly of indigenous European hunter-gatherer origin, while Southern Europeans are largely derived from Neolithic farmers of mixed European and Near Eastern origin. But the authors identify a minimum of three ancestral populations from their stats (WHG, EEF and ANE), and four meta-populations from the available ancient data (WHG, EEF, ANE and SHG). Here are brief summaries of each of these groups:
West European Hunter-Gatherer (WHG): this ancestral component is based on an 8,000 year-old forager from the Loschbour rock shelter in Luxembourg (one of the individuals mentioned above belonging to I2a1b). The WHG meta-population includes the Loschbour sample and two Mesolithic individuals from the La Brana Cave in Spain. However, today the WHG component peaks among Estonians and Lithuanians, in the East Baltic region, at almost 50%.
Early European Farmer (EEF): apparently this is a hybrid component, the result of mixture between "Basal Eurasians" and a WHG-like population possibly from the Balkans. It's based on the aforementioned LBK farmer from Stuttgart, but today peaks at just over 80% among Sardinians. Apart from the Stuttgart sample, the EEF meta-population includes Oetzi the Iceman and a Neolithic Funnelbeaker farmer from Sweden.
Ancient North Eurasian (ANE): this is the twist in the tale, a component based on a previously reported genome of a 24,000 year-old Upper Paleolithic forager from South Central Siberia, belonging to Y-hg R*, and known as Mal'ta boy or MA-1 (see here). This component was very likely present in Southern Scandinavia since at least the Mesolithic (see the summary of SHG below), but only seems to have reached Western Europe after the Neolithic. At some point it also spread into the Americas. In Europe today it peaks among Estonians at just over 18%, and, intriguingly, reaches a similar level among Scots. However, numbers weren't given for Finns, Russians and Mordovians, who, according to one of the maps, also carry very high ANE, but their results are confounded by more recent Siberian admixture (see the discussion on the European outliers below). The ANE meta-population includes Mal'ta boy as well as a late Upper Paleolithic sample from Central Siberia, dubbed Afontova Gora-2 (AG2).
Scandinavian Hunter-Gatherer (SHG): this is a meta-population made up of Swedish Mesolithic and Neolithic forager samples from Motala and Gotland, respectively. It's a more easterly variant of WHG, with probable ANE admixture.
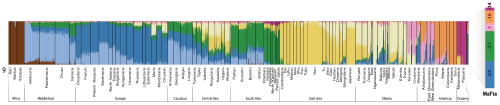
Below are the two most important figures from the paper: a) the three-way mixture model that is a statistical fit to the data, and b) a plot of the proportions of ancestry from each of the three inferred ancestral populations. As per above, East Baltic populations are the most WHG, which is somewhat curious, because they mostly carry Y-DNA R1a and N1c1.

So if not for the ANE, we'd simply have a two-way mixture model between indigenous European foragers and migrant Near Eastern farmers, at least for most Europeans anyway. Moreover, the seemingly late and sudden arrival of ANE in much of Europe is important, because it's a smoking gun for a major population upheaval across the continent during the Late Neolithic/Early Bronze Age.
Interestingly, archeological data suggest that this was also the period which saw the introduction of new social organization and perhaps Indo-European languages across most of Europe. None of this was lost on the authors of the paper, but it appears they'd rather be cautious pending more ancient genomic data, because they chose not to explicitly mention the Indo-Europeans.
This study raises two questions that are important to address in future research. A first is where the EEF picked up their WHG ancestry. Southeastern Europe is a candidate as it lies along the geographic path from Anatolia into central Europe, and hence it should be a priority to study ancient samples from this region. A second question is when and where ANE ancestors admixed with the ancestors of most present-day Europeans. Based on discontinuity in mtDNA haplogroup frequencies in Central Europe, this may have occurred during the Late Neolithic or early Bronze Age ~5,500-4,000 years ago35. A central aim for future work should be to collect transects of ancient Europeans through time and space to illuminate the history of these transformations.
...
The absence of Y-haplogroup R1b in our two sample locations is striking given that it is, at present, the major west European lineage. Importantly, however, it has not yet been found in ancient European contexts prior to a Bell Beaker burial from Germany (2,800-2,000BC)12, while the related R1a lineage has a first known occurrence in a Corded Ware burial also from Germany (2,600BC)13. This casts doubt on early suggestions associating these haplogroups with Paleolithic Europeans14, and is more consistent with their Neolithic entry into Europe at least in the case of R1b15, 16. More research is needed to document the time and place of their earliest occurrence in Europe. Interestingly, the Mal’ta boy belonged to haplogroup R* and we tentatively suggest that some haplogroup R bearers may be responsible for the wider dissemination of Ancient North Eurasian ancestry into Europe, as their haplogroup Q relatives may have plausibly done into the Americas17.
No doubt, a lot of people will now be wondering about the main source of the ANE that apparently rushed into Europe at the onset of the metal ages. The Siberian steppe will probably be the favored option for many, since this is where Mal'ta boy and Afontova Gora-2 were dug up. However, I'm pretty sure the source was Eastern Europe.
First of all, as already mentioned, it seems that ANE was present in Sweden during the Mesolithic (Figure S12.7 shows around 19% ANE in the Motala12 sample). Secondly, despite the ANE and WHG being classified as separate ancestral and meta-populations, the differences between them appear to be clinal rather than discrete, which I think can be seen in the PCA and ADMIXTURE results from the study (see here and here). Thus, I'd expect a lot more ANE in Eastern Europe during the Mesolithic than in Scandinavia. Thirdly, it's likely that the ancestors of modern Uralic speakers were in Siberia very early, possibly during the Mesolithic, and they were probably East Eurasians aka. Eastern non-Africans (ENA), which ANE is not.
Indeed, latest linguistics research suggests that the pre-proto-Uralics migrated at some point from Siberia into the southern Urals, in far eastern Europe. The Uralics proper then expanded from the southern Urals, probably during the Bronze Age, both to the east and west, as far as the Baltic. This Uralic expansion is certainly reflected in the Lazaridis et al. data, and it's not the only relatively late migration into Europe that shows up in their stats.
While our three-way mixture model fits the data for most European populations, two sets of populations are poor fits. First, Sicilians, Maltese, and Ashkenazi Jews have EEF estimates beyond the 0-100% interval (SI13) and they cannot be jointly fit with other Europeans (SI12). These populations may have more Near Eastern ancestry than can be explained via EEF admixture (SI13), an inference that is also suggested by the fact that they fall in the gap between European and Near Eastern populations in the PCA of Fig. 1B. Second, we observe that Finns, Mordovians, Russians, Chuvash, and Saami from northeastern Europe do not fit our model (SI12; Extended Data Table 3). To better understand this, for each West Eurasian population in turn we plotted f4(X, Bedouin2; Han, Mbuti) against f4(X, Bedouin2; MA1, Mbuti), using statistics that measure the degree of a European population’s allele sharing with Han Chinese or MA1 (Extended Data Fig. 7). Europeans fall along a line of slope >1 in the plot of these two statistics. However, northeastern Europeans fall away from this line in the direction of Han. This is consistent with Siberian gene flow into some northeastern Europeans after the initial ANE admixture, and may be related to the fact that Y-chromosome haplogroup N 30, 31 is shared between Siberian and northeastern Europeans32, 33 but not with western Europeans. There may in fact be multiple layers of Siberian gene flow into northeastern Europe after the initial ANE gene flow, as our analyses reported in SI 12 show that some Mordovians, Russians and Chuvash have Siberian-related admixture that is significantly more recent than that in Finns (SI12).
The authors are actually referring to the Kargopol Russians from the HGDP in that quote. But from my own analyses with a wide variety of samples from Russia, I know that other Russians show similar levels of Siberian admixture to Belorussians, Ukrainians and Estonians.
In any case, this of course means that there are more than three ancestral populations for present-day Europeans, albeit not all of them influenced all Europeans. Also, it's very clear that to learn all the details about the peopling of Europe, these sorts of studies really need to start focusing on the large swath of land that stretches from present-day Poland to the Urals. In other words, Eastern Europe.
I was also going to discuss the genetically inferred pigmentation of the ancient individuals, but, because of the small sample size, there's not much to discuss at this stage. The Loschbour forager possibly had blue eyes (50% chance), but dark hair and skin. On the other hand, the Stuttgart farmer definitely had dark eyes and hair, but relatively light skin. I wonder if this swarthy hunter-gatherer skin complexion has anything to do with the fact that today lots of people from around the Baltic tan really well?
Citation...
Iosif Lazaridis, Nick Patterson, Alissa Mittnik, et al., Ancient human genomes suggest three ancestral populations for present-day Europeans, bioRxiv, Posted December 23, 2013, doi: 10.1101/001552
See also...
Another look at the Lazaridis et al. ancient genomes preprint
The really old Europe is mostly in Eastern Europe
EEF-WHG-ANE test for Europeans
First genome of an Upper Paleolithic human
ADMIXTURE analysis of Allentoft et al. and Haak et al. ancient genomes
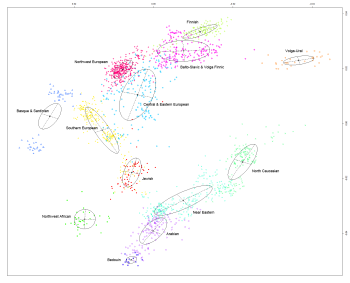
I ran a quick Mclust analysis to get a better idea of the substructures in my recently updated dataset of West Eurasian samples. Mclust found that the optimal outcome was produced with 18 dimensions of genetic variation and 13 clusters, the latter of which are superimposed on a two dimensional MDS plot below. I chose the labels for the clusters myself and flipped the canvass to fit geography.
Here you can see the 13 clusters superimposed on all possible combinations of the 18 dimensions. Clicking on the image will take you to a 10.3MB PDF file.
It's interesting to note the presence of the very tight Jewish cluster, which includes Ashkenazi, Sephardic and Moroccan Jews. The Basques and Sardinians also cluster together, despite being clearly distinct from each other in the fist two dimensions. This is fascinating because these two groups have been mentioned a few times now in various studies and presentations as being the best modern proxies for Europe's Neolithic farmers.
The widespread Central and Eastern European cluster mostly includes individuals from populations that aren't easily characterized in these sorts of tests, and that's basically because they're of mixed origin. Indeed, I suspect things would look somewhat different in that part of the plot if I had more sizable numbers from Germany, Scandinavia, Poland and nearby areas.
Mclust can produce many more clusters than just 13 from the same data, but as per above, I wanted to see what would happen if it was asked to come up with the optimal solution. For more on this type of analysis check out the articles here, here and here.
Update 17/12/2013: On a related note, here's an Mclust analysis of West, Central and South Asia. The optimal result was obtained with 10 dimensions and 14 clusters. Please note that although some of the clusters have the same names as in the analysis above, they aren't the same clusters.
See also...
Eurogenes' North Euro clusters - phase 2, final results
A new paper at Nature reports on the genome of a 24,000 year-old Siberian known as Mal'ta boy or MA-1. Here's the abstract:
The origins of the First Americans remain contentious. Although Native Americans seem to be genetically most closely related to east Asians1, 2, 3, there is no consensus with regard to which specific Old World populations they are closest to 4, 5, 6, 7, 8. Here we sequence the draft genome of an approximately 24,000-year-old individual (MA-1), from Mal’ta in south-central Siberia9, to an average depth of 1×. To our knowledge this is the oldest anatomically modern human genome reported to date. The MA-1 mitochondrial genome belongs to haplogroup U, which has also been found at high frequency among Upper Palaeolithic and Mesolithic European hunter-gatherers10, 11, 12, and the Y chromosome of MA-1 is basal to modern-day western Eurasians and near the root of most Native American lineages5. Similarly, we find autosomal evidence that MA-1 is basal to modern-day western Eurasians and genetically closely related to modern-day Native Americans, with no close affinity to east Asians. This suggests that populations related to contemporary western Eurasians had a more north-easterly distribution 24,000 years ago than commonly thought. Furthermore, we estimate that 14 to 38% of Native American ancestry may originate through gene flow from this ancient population. This is likely to have occurred after the divergence of Native American ancestors from east Asian ancestors, but before the diversification of Native American populations in the New World. Gene flow from the MA-1 lineage into Native American ancestors could explain why several crania from the First Americans have been reported as bearing morphological characteristics that do not resemble those of east Asians2, 13. Sequencing of another south-central Siberian, Afontova Gora-2 dating to approximately 17,000 years ago14, revealed similar autosomal genetic signatures as MA-1, suggesting that the region was continuously occupied by humans throughout the Last Glacial Maximum. Our findings reveal that western Eurasian genetic signatures in modern-day Native Americans derive not only from post-Columbian admixture, as commonly thought, but also from a mixed ancestry of the First Americans.
Indeed, MA-1 looks like he could be an early ancestor of present-day West Eurasians, including and especially Europeans. Mitochondrial haplogroup U was almost fixed in Upper Paleolithic and Mesolithic Europe, while R1a and R1b are, after all, the most common and widespread Y-chromosome haplogroups in Europe today.
Below is the bar graph from the K=9 ADMIXTURE analysis, which turned out to be the optimal run. Note that the Mal'ta sample appears mostly South Asian (37%), European (34%), and Amerindian (26%), but also with minor Oceanian ancestry (4%). Interestingly, among the Europeans, it's the groups from Northern and Eastern Europe that carry the highest levels of these components. This is probably a reflection, at least in large part, of their elevated indigenous European hunter-gatherer ancestry.
At K = 9, MA-1 is composed of five genetic components of which the two major ones make up ca. 70% of the total. The most prominent component is shown in green and is otherwise prevalent in South Asia but does also appear in the Caucasus, Near East or even Europe. The other major genetic component (dark blue) in MA-1 is the one dominant in contemporary European populations, especially among northern and northeastern Europeans. The co-presence of the European-blue and South Asian green in MA-1 can be interpreted as admixture of the two in MA-1 or, alternatively, MA-1 could represent a proto-western Eurasian prior to the split of Europeans and South Asians. This analysis cannot differentiate between these two scenarios. Most of the remaining nearly one third of the MA-1 genome is comprised of the two genetic components that make up the Native American gene pool (orange and light pink). Importantly, MA-1 completely lacks the genetic components prevalent in extant East Asians and Siberians (shown in dark and light yellow, respectively). Based on this result, it is likely that the current Siberian genetic landscape, dominated by the genetic components depicted in light and dark yellow (Figure SI 6), was formed by secondary wave(s) of immigrants from East Asia.
Here's a figure showing the levels of shared genetic drift between MA-1 and 147 present-day non-African populations. Among the Europeans it's the Lithuanians, Northwestern Russians and Baltic and Volga Finns who are most similar to the ancient sample. It's also interesting to note the relatively high position on the list of the Kalash from South Central Asia and Lezgins from the North Caucasus. At the bottom are Bedouins and Palestinians, mainly because of their non-trivial Sub-Saharan admixture, followed by Oceanians, East Asians, and South Indians, probably due to deep differentiation between their main ancestral clades and that of MA-1.

I've heard that the same team of scientists is now trying to sequence genomes from Upper Paleolithic sites west of Mal'ta. I wonder how far west? I see that the authors mention the Sungir site from near Moscow a couple of times in the paper, in relation to its similarity to the Mal'ta site. Perhaps they're working on a Sungir genome right now? If so, what's the bet that the Y-DNA turns out to be another basal R?
Citation...
Raghavan et al., Upper Palaeolithic Siberian genome reveals dual ancestry of Native Americans, Nature, (2013), Published online 20 November 2013, doi:10.1038/nature12736
As far as I can tell, these videos came online only a few weeks ago. They're from a conference titled "Tracing the Indo-Europeans: Origin and migration", which was held in Copenhagen late last year as part of the Roots of Europe project. I've had a quick look at the selection below, and the impression I get is that the guest speakers would rather eat shards of glass than accept that the Indo-European homeland was in Anatolia (ie. the so called Anatolian hypothesis). Also, interestingly, in the last video, Kristian Kristiansen discusses the possibility that the origin of the Maritime Bell Beaker culture was in the Aegean region, and that it might have been Proto-Celtic. If the sound is too low, use VLC Media Player and crank up the volume.
Adam Hyllested: Indo-European homeland and dispersals: Contemporary linguistic evidence
Guus Kroonen: The linguistic heritage of the European Neolithic: Non-Indo-European words in Germanic
David Anthony: Early Indo-European migrations, economies, and phylogenies
Kristian Kristiansen: Trade, travels and the transmission of cultural change in the Bronze Age
Morten Allentoft: Using ancient DNA to study human evolution and migration
David Anthony: Wheeled vehicles, horses, and Indo-European origins
Kristian Kristiansen: The Bronze Age expansion of Indo-European languages
Despite some claims to the contrary across the web today, there's really nothing new or controversial about this Moorjani et al. paper, considering all of the non-academic data available online on South Asian genome-wide and Y-chromosome genetic structure. In fact, I think the authors were way too cautious and diplomatic in their assessment of the post-Neolithic population history of the region.
It is also important to emphasize what our study has not shown. Although we have documented evidence for mixture in India between about 1,900 and 4,200 years BP, this does not imply migration from West Eurasia into India during this time. On the contrary, a recent study that searched for West Eurasian groups most closely related to the ANI ancestors of Indians failed to find any evidence for shared ancestry between the ANI and groups in West Eurasia within the past 12,500 years3 (although it is possible that with further sampling and new methods such relatedness might be detected). An alternative possibility that is also consistent with our data is that the ANI and ASI were both living in or near South Asia for a substantial period prior to their mixture. Such a pattern has been documented elsewhere; for example, ancient DNA studies of northern Europeans have shown that Neolithic farmers originating in Western Asia migrated to Europe about 7,500 years BP but did not mix with local hunter gatherers until thousands of years later to form the present-day populations of northern Europe.15, 16, 44 and 45
Here's my non-diplomatic assessment of the data presented in the paper: South Asia has seen multiple waves of population movements from West and Central Asia since the Neolithic, including the Indo-Aryan invasion during the Bronze Age, which reshaped the genetic structure of the region in a remarkable way. Indeed, the Aryan invasion introduced into South Asia one of the most common Y-chromosome lineages there today: R1a-Z93 or R1a1a1b2*. Obviously, scientists working on the problem of the peopling of South Asia really need to become aware of this marker, and in particular its very close relationship to the Northern and Eastern European-specific R1a-Z283.
Citation...
Priya Moorjani et al., Genetic Evidence for Recent Population Mixture in India, The American Journal of Human Genetics, 08 August 2013, doi:10.1016/j.ajhg.2013.07.006
See also...
Origins of R1a1a in or near Europe (aka. R1a1a out of India theory looks like a dud)
South Asian R1a in the 1000 Genomes Project
Southwest Eurasians + Northwest Eurasians + Mesolithic survivors = modern Europeans
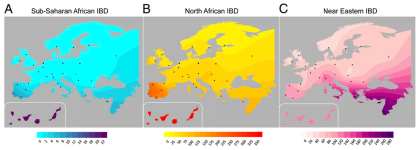
A new paper at PNAS by Botigué et al. takes a close look at African and Near Eastern admixture in Europe:
Human genetic diversity in southern Europe is higher than in other regions of the continent. This difference has been attributed to postglacial expansions, the demic diffusion of agriculture from the Near East, and gene flow from Africa. Using SNP data from 2,099 individuals in 43 populations, we show that estimates of recent shared ancestry between Europe and Africa are substantially increased when gene flow from North Africans, rather than Sub-Saharan Africans, is considered. The gradient of North African ancestry accounts for previous observations of low levels of sharing with Sub-Saharan Africa and is independent of recent gene flow from the Near East. The source of genetic diversity in southern Europe has important biomedical implications; we find that most disease risk alleles from genome-wide association studies follow expected patterns of divergence between Europe and North Africa, with the principal exception of multiple sclerosis.
The term "recent" is used throughout the paper to describe the IBD results, but as far as I can see there's no mention of any dates. Based on the data in the very thorough Ralph and Coop European IBD study (see here), I'd say that segments of over 1.5cM represent gene flow from well within the past 5,000 years. If this assumption is correct, then the results certainly make a lot of sense. That's because there were well documented historical events that could account for the main outcomes in the figure below: a) low level IBD sharing between Sub-Saharan Africa and much of Southern Europe; b) inflated IBD sharing between North Africa and Southwestern Europe; and c) inflated IBD sharing between Southeastern Europe and the Near East.
I probably don't need to discus in detail what these events might have been. Suffice it to say that the Mediterranean Basin has seen several major empires which facilitated regular population movements between Southern Europe, North Africa and the Near East. This process included the slave trade, which was one of the main economic activities in the region for a couple thousand years.
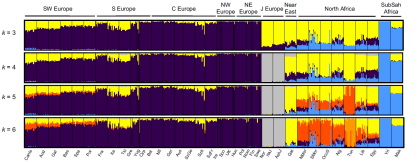
It's important to note, however, that fastIBD doesn't specify the direction of gene flow. In other words, shared IBD segments can be the result of our ancestors either receiving or giving admixture, or gene flow from a third party. But as Botigué et al. point out, the North African samples which show the highest IBD sharing with Iberians are also those with the lowest European ancestry proportions in the ADMIXTURE analysis (see below). Therefore, it's unlikely that this shared IBD is of European origin in any significant degree.
Key: Canis - Canary Islands; And - Andalusia; Gal - Galicia; Bas - Basques; Spa - Spain; Por - Portugal; Fra - France; Ita - Italy; Tsi - Tuscany; Gre - Greece ; ItaJ - Italian Jews; AshJ - Ashkenazi Jews; Qat - Qatar; NMor - North Morocco; SMor - South Morocco; OccS - Saharawi; Alg - Algeria; Tun - Tunisia; Lib - Libya; Egy - Egypt; Yri - Yoruba from Nigeria; Mkk - Maasai from Kenya.
There's also a PCA in the supplementary PDF which further underlines that most of the IBD sharing between Europe and North Africa, as well as Qatar, is not of European origin, because it creates significant substructures within the European sample.
Unfortunately the Qataris are the only Near Eastern sample used in the study. Then again, if I was to pick a single ethnic group to represent the Near East in an IBD study like this, then Qataris would probably be near the top of the list. That's because they've been affected by population movements from other parts of the Arabian Peninsula and also Persia, but at the same time never experienced significant gene flow from Europe. More information about the genome-wide genetic ancestry of Qataris is available in this recent open-access paper by Omberg et al.
Botigué et al. also make some interesting comments about Jewish genetic ancestry in Europe. The quote below comes from the supplementary PDF.
Another possible hypothesis to explain the increased diversity in southern Europe is that an influx of Jewish ancestry had a heterogeneous effect on genetic diversity in Europe. However, in most European populations here, virtually no Jewish ancestry was detected. On average, 1% of Jewish ancestry is found in Tuscan HapMap population and Italian Swiss, as well as Greeks and Cypriots. This may reflect the higher sharing with Near Eastern populations in the Italian peninsula and southeastern Europe (Fig. 2C) or low levels of gene flow with the early Italian Jewish communities (6). Estimates from the IBD analysis are in agreement with ADMIXTURE estimates that the amount of sharing between these populations is extremely low (SI Appendix, Table S3). Specifically, results of IBD sharing between southwestern Europe and North Africa are two orders of magnitude greater than those found between the same region and Jews, the average WEA for southern Europe and North Africa is 203, while for southwestern Europe and European Jews is 1.3.
Reference...
LR Botigué*, BM Henn*, S Gravel, BK Maples, CR Gignoux, E Corona, G Atzmon, E Burns, H Ostrer, C Flores, J Bertranpetit, D Comas, CD Bustamante, Gene flow from North Africa contributes to differential human genetic diversity in Southern Europe, PNAS, published online before print June 3, 2013, doi: 10.1073/pnas.1306223110
After a recent update, the 1000 Genomes project now includes 62 individuals of South Asian origin belonging to Y-DNA haplogroup R1a-M17. Their full Y-chromosome sequences have been analyzed by Semargl and Maximus (aka. YFull project), with some interesting but not unexpected results:
- All individuals belong to R1a-Z93, which appears to totally dominate South Asian R1a-M17.
- A single Punjabi from Lahore, northeastern Pakistan, is ancestral for the Z94 mutation, which is just below Z93. All the other individuals are derived for Z94.
- Six individuals - of Punjabi, Bangladeshi and Gujarati origin - are ancestral for L657 and Z2124, the two main mutations immediately below Z94.
- All individuals of South Indian and Sri Lankan origin are derived for L657 or Z2124.
- Based on this sample, there appears to be no substructure along ethnic or geographic lines within South Asian R1a-M17 derived for L657 and Z2124.
Thus, it seems the SNP diversity of South Asian R1a-M17 is low, and decreases from Pakistan, North India and Bangladesh to South India and Sri Lanka. In comparison, there are only 12 European R1a individuals in the 1000 Genomes sample, and they represent all the major subclades of this haplogroup: R1a-Z283, R1a-Z93 and R1a-L664. Therefore, sampling bias can't be used as an argument for the more diverse result from Europe.
The lack of substructure along ethnic and geographic lines within South Asian R1a-L657 and R1a-Z2124 looks unusual, especially considering the caste system in India, and needs to be verified with more extensive sampling. However, if this outcome holds up, it'll suggest that paternal gene flow across South Asia has not been restricted by the caste system or geography. Then again, it could mean the caste system appeared after R1a-L657 and R1a-Z2124 arrived in South India via massive population movements from the north.
Below are all the results in as much detail as the current R1a SNP tree allows. Key: BEB - Bengali from Bangladesh; GIH - Gujaratai from Houston, Texas; ITU - Indian Telugu from the UK; PJL - Punjabi from Lahore, Pakistan; STU - Sri Lankan Tamil from the UK.
Z93+ Z94-
PJL - 1
Z94+ L657- Z2124- Z96-
BEB - 2
PJL - 3
GIH - 1
L657+,Y2+ etc.
1) Y9 (inc. Y7)
GIH - 7
STU - 4
ITU - 4
PJL - 8
BEB - 2
2) Y4+, Y8+, Y28+ (inc. Y6+)
GIH - 6
ITU - 6
PJL - 2
STU - 6
BEB - 5
Z2125+ (Z2124+ Z2122- Z2123-)
PJL - 1
Z2123+ (Z2124+ Z2122-, Z2125-)
PJL - 2
STU - 3
BEB - 1
ITU - 6
GIH - 2